AgricultureNational
UGANDA: THE BUREAU OF STATISTIC IT LOOKS HOLLOW, GIVING NEGATIVE REPORT INCLUDING OMORO DISTRICT SOYBEANS PRODUCTIONS AREAS.
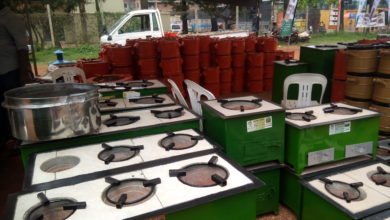
Omoro district is leading in soyabeans farming, each season they are producing 800 tonnes of matrix soyas
Acholi Sub Region has gaining significantly in term of household income as Soybeans price shoot up from UGX 8, 00 to UGX 3,000 in 2021. In one sub county, Lakwaya village 30 household got over 2 tones of Soybeans
, which earned each UGX 22 million.
Petter Oweka, is a proud man who has turned himself to become a produce buyer of Soyabeans at Lobo oloyi or conor Lapangcata toward Opit, Town council, in Omoro district.
| Full report
BOS has released the 2019/20 National Household Survey Report. Someone has taken the trouble to summarise it for busy hands like yours.
In summary, this is Uganda today:
1. Total population = 41m
2. Average family size = 4.6 persons (largest in Teso 5.9 and smallest in Kampala 3.4)
3. Popn below 18yrs = 54%
4. Urban population = 27%
5. Net pri sch enrollment = 91%
6. Net sec sch enrollment = 27% (Highest in Kampala 52%; lowest in Acholi 7%)
7. Literacy rate = 76% (adults only 72%)
8. Popn with non-communicable diseases = 3.5%
9. Popn that abuse alcohol = 18%(highest in Karamoja 48%; lowest in Busoga 4%)
10. Health insurance coverage = 4% (down from 5% in 2017)
11. Ugandans working (o/o working age popn) = 74% (down from 79% in 2017)
12. Agric workers = 68% (up from 64% in 2017)
13. Child labour = 28%
14. Improved water source = 79%
15. 3 in 10 Ugandans have improved toilet
16. Connection to grid electricity = 19% (down from 22% in 2017)
17. Connection to solar = 38% (up from 18% in 2017)
18. Mobile phones = 74%
19. Radios = 32% (down from 45% in 2017)
20. Television = 19% (up from 17% in 2017)
21. Computers = 2%
22. Internet use = 83% for social networking; 16% for business
23. HHs operating a business = 31% (down from 38% in 2017)
24. Source of capital = 81% own savings (loans from banks 0.4%)
25. HHs in subsistence economy = 39% i.e. 3.5m from 3.3m in 2017.
26. Population in poverty = 20.3% (down from 21.4% in 2017)
27. Total population in poverty = 8.3m (up from 8m in 2017)
28. Poverty distribution: Acholi 68%, Karamoja 66%, Bukedi 35%, Busoga 29%, Kigezi 28%, Lango 23%, Teso 22%, West Nile 17%, North Buganda 14%, *Elgon 13%*, Ankole 13%, Tooro 13%, Bunyoro 10%, South Buganda 7%, Kampala 2%.
29. Contribution to national poverty by region: Busoga 14.5%, Bukedi 10.4%, Acholi 10.3%, Northern Buganda 8.1%, Teso 7.1%, Karamoja 6.5%, Tooro 6.5%, Ankole 6.4%, Lango 5.4%, South Buganda 5.3%, West Nile 5.2%, Kigezi 5.2%, Bunyoro 4.3%, *Elgon* 4.1%, Kampala 0.5%.
30. Regions where poverty has reduced: West Nile (from 35% in 2017 to 17% in 2020), Bunyoro (from 17% to 10%), Teso (from 25% to 22%), *Elgon* (from 35% to 13%) Bukedi (from 44% to 35%), Busoga (from 38% to 29%), South Buganda (from 9% to 7%), Kampala (from 3% to 2%).
31. Regions where poverty increased: Acholi (from 33% in 2017 to 68% in 2020), Ankole (from 7% to 12%), Karamoja (from 60% to 66%), Lango (from 16% to 23%), Kigezi (from 12% to 28%), Tooro (from 11% to 13%), and North Buganda (from 11% to 14%)
Source: UBOS (2021)
|